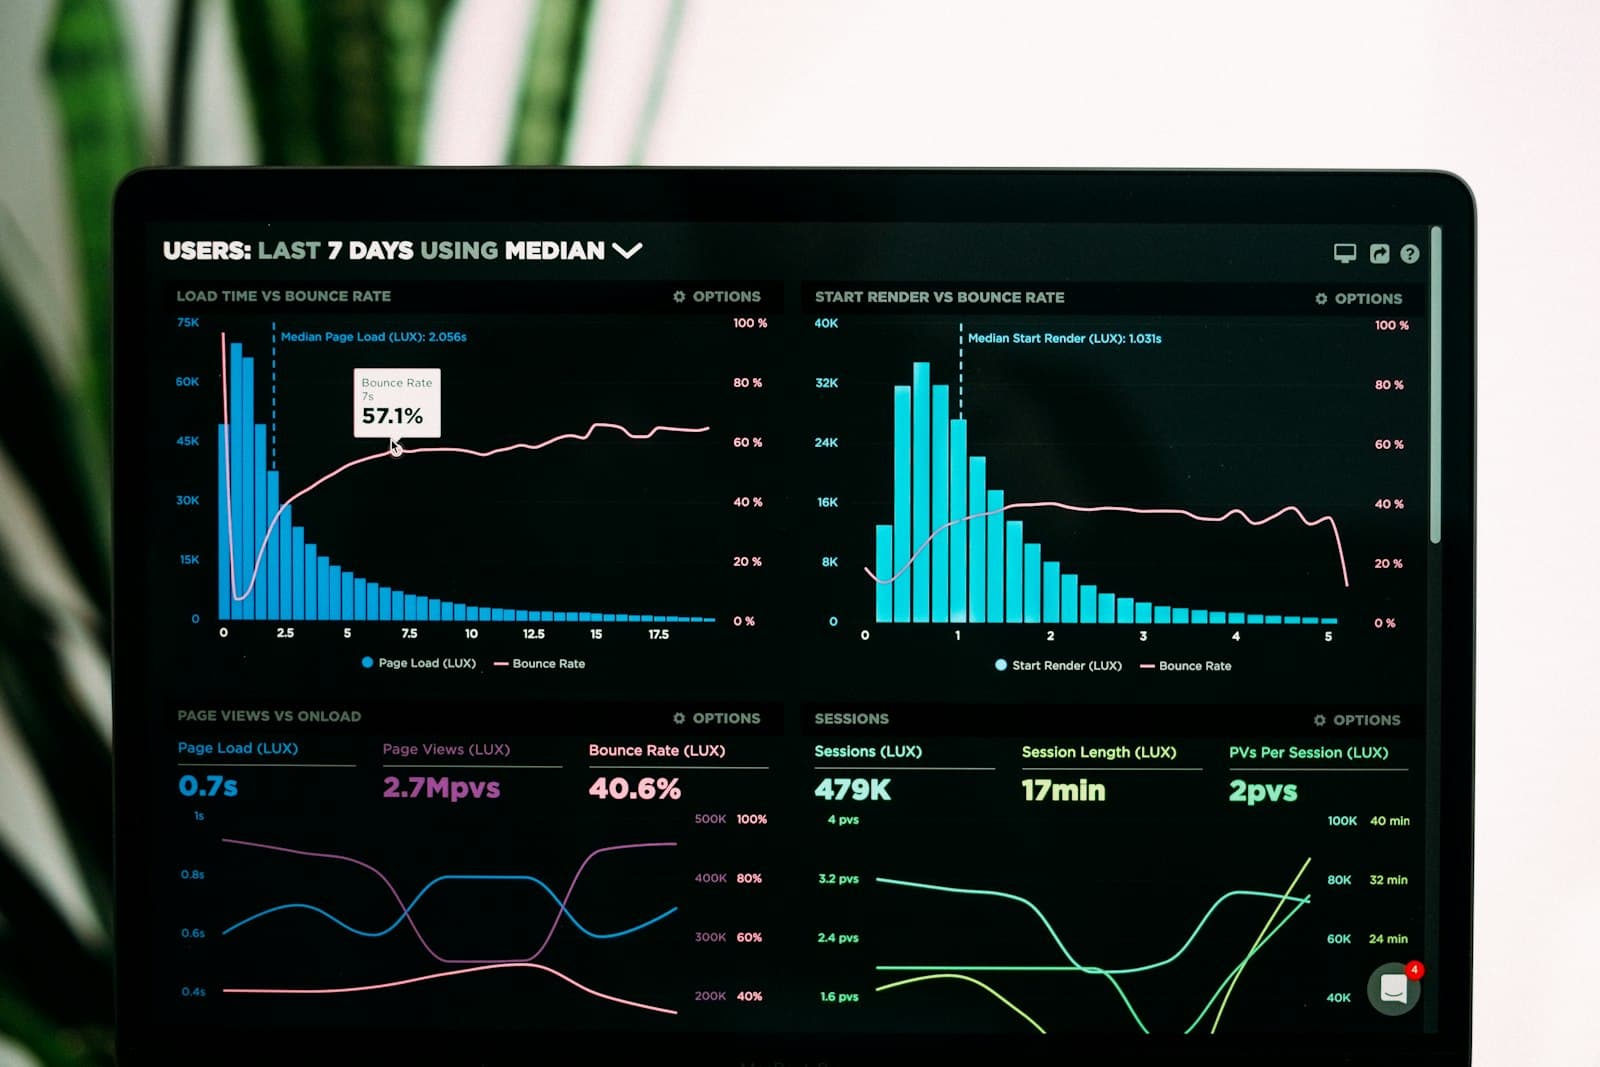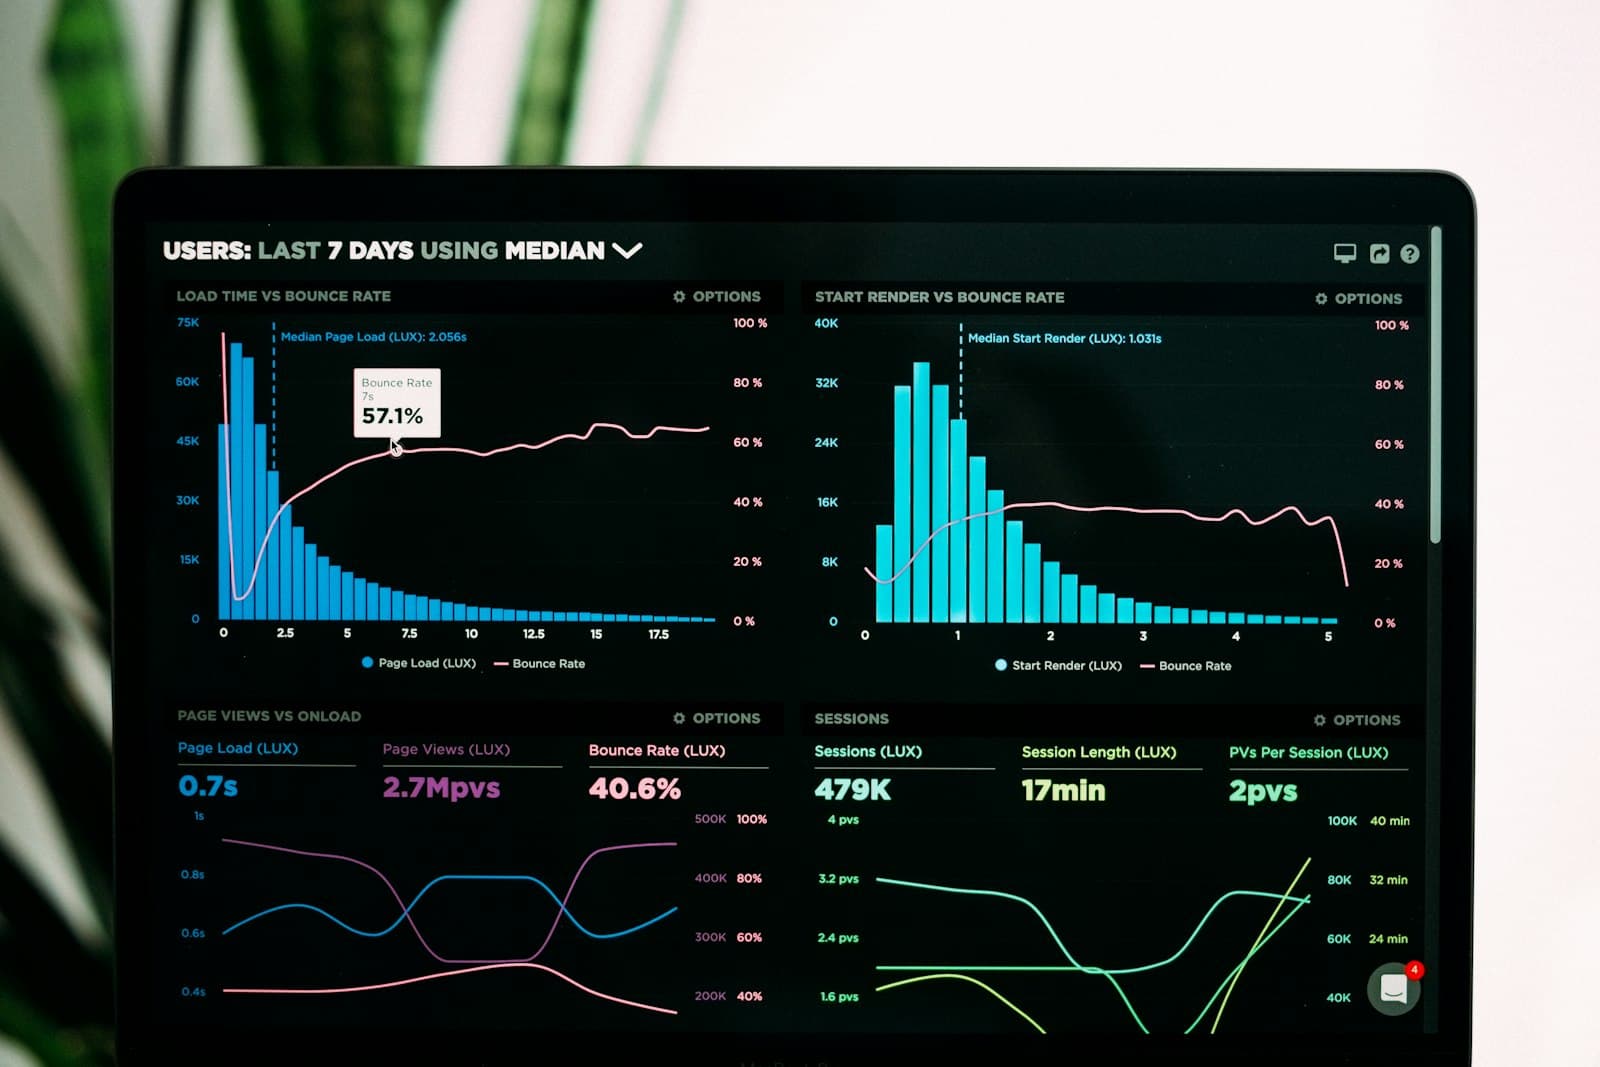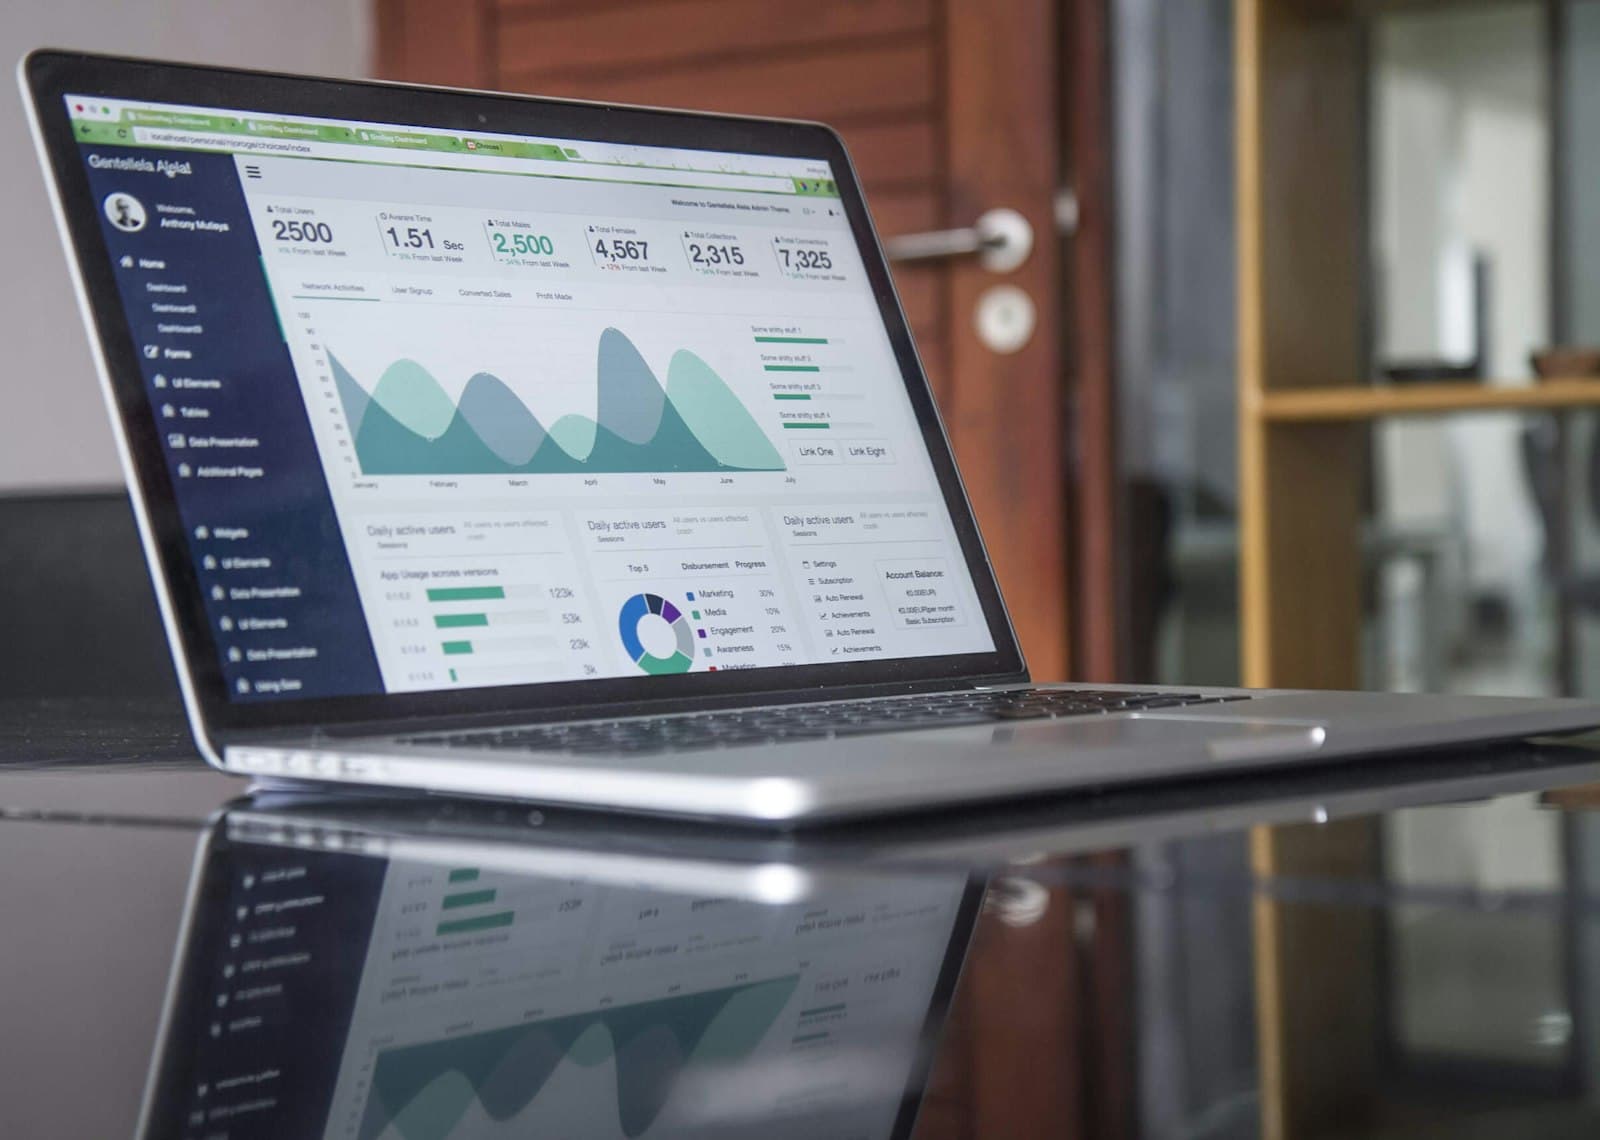
Led the consolidation of sales and web analytics data from across 18 European markets into a single BigQuery data lake, working with the lead technology agency and internal analytics experts to build market-specific and central reporting through Looker.
→ 19 dashboards and reporting suites across 18 markets.
Problem
Honda's European operation held sales data and website analytics data in separate systems, market by market. There was no single place to see performance across the 18 territories, and no shared reporting standard that regional marketing teams and central leadership could both work from.
Context
As European Digital Platform Section Manager, I owned the platform's data and reporting capability alongside its commercial performance. Eighteen markets meant eighteen different starting points, so this wasn't a single integration but a programme covering sales systems and web analytics across the whole region.
Business objective
Give regional marketing teams and central European stakeholders a shared, reliable view of performance, without forcing every market into an identical report that ignored local context.
Customer/user objective
Regional marketing teams needed dashboards relevant to their own market. Central European stakeholders and the agency needed a consolidated view across all of them.
Constraints
Eighteen markets meant eighteen sets of local data conventions and priorities feeding into one lake. The reporting had to work for both a market manager checking their own numbers and a central stakeholder comparing across the region.
Stakeholders
Regional marketing teams in each of the 18 markets, the lead technology agency and Honda's internal analytics experts who carried out the technical build, and European Honda stakeholders who needed the central view.
Research and discovery
I worked with the lead technology agency and our internal analytics experts to map what data existed where, market by market, and where sales data and website analytics data diverged in structure. The consistent gap was a single, trusted source both regional and central stakeholders could report from.
Options considered
One option was to leave reporting at the market level and layer a manual central summary on top. I chose a single data lake in BigQuery instead, built with the lead technology agency and internal analytics experts, so every dashboard, market-level or central, drew from the same underlying data.
Prioritisation
Getting sales and web analytics data into BigQuery came first, since no dashboard would be trustworthy without a consolidated source behind it.
Delivery
I led the project end to end, directing the lead technology agency and Honda's internal analytics experts who carried out the technical build. Together we consolidated sales data and website analytics data from all 18 markets into a single BigQuery data lake, then built Looker dashboards on top, one bespoke reporting suite per market plus a central European view. Nineteen dashboards and reporting suites in total.

Decisions made
I decided the dashboards should be market-specific rather than one generic template applied to all 18, since a single view wouldn't have served any one market well. The central European dashboard was a deliberate addition on top, not a substitute for the market-level ones.
Trade-offs
Building 19 separate dashboards took longer than one shared template would have, but a generic report would have been less useful to any individual market team, and I judged that trade worth making.
Business outcome
Regional marketing teams and European stakeholders gained visibility they didn't have before, from 19 dashboards and reporting suites covering 18 markets plus a central European view.

Customer outcome
Regional marketing teams could see their own market's performance in one place instead of piecing it together from separate systems, and central stakeholders could compare across markets on the same data.
Lessons learned
Consolidating data from 18 markets surfaces inconsistencies you don't see until you try to report on them side by side. Building market-specific dashboards rather than one shared template took more effort but meant the reporting was actually used, not worked around.
What I'd improve today
I'd standardise the underlying data conventions across markets earlier in the process, so less of the BigQuery consolidation work involved reconciling different formats after the fact.